Perspectiva mensual de Coinbase: ¿Cómo defines un mercado bajista de cripto?
Reenviar el Título Original 'Perspectiva Mensual: ¿Cómo Define un Mercado bajista de Cripto?'
BTC y el índice COIN50 recientemente han roto por debajo de sus respectivas 200DMAs, lo que señala un posible mercado bajista para la cripto.

Claves principales
- El valor total del mercado de criptomonedas (excluyendo BTC) ha experimentado una pronunciada caída del 41% desde su máximo de diciembre de 2024 de $1.6T a $950B a mediados de abril, mientras que la financiación de capital de riesgo ha disminuido entre un 50-60% respecto a los niveles de 2021-22.
- Creemos que esto justifica adoptar una postura defensiva en cuanto al riesgo por el momento, aunque creemos que los precios de las criptomonedas pueden encontrar su suelo a mediados o finales del 2T25, preparando un mejor 3T25.
Resumen
Varias señales convergentes pueden estar apuntando al inicio de un nuevo 'invierno cripto' ya que cierto sentimiento negativo extremo se ha instalado debido al inicio de aranceles globales y la posibilidad de mayores escaladas. La capitalización total del mercado cripto (excluyendo BTC) ahora se sitúa en $950B, un pronunciado descenso del 41% desde su máximo de $1.6T en diciembre de 2024 y un 17% por debajo de los niveles del mismo período del año pasado. Para poner esto en perspectiva, es aún más bajo que casi todo el período desde agosto de 2021 hasta abril de 2022.
Al mismo tiempo, la financiación de capital de riesgo en cripto se recuperó en el 1T25 con respecto al trimestre anterior, pero todavía está un 50-60% por debajo de los niveles observados durante el pico del ciclo 2021-22. Esto limita significativamente la incorporación de nuevo capital al ecosistema, especialmente en el lado de las altcoins. Todas estas presiones estructurales se derivan de la incertidumbre del entorno macroeconómico más amplio, donde los activos de riesgo tradicionales han enfrentado vientos en contra sostenidos debido al endurecimiento fiscal y las políticas arancelarias, lo que contribuye a la parálisis en la toma de decisiones de inversión. Con las acciones luchando, el camino hacia la recuperación de cripto sigue siendo desafiante incluso con los vientos favorables idiosincráticos del entorno regulatorio.
La interacción de estos factores dibuja una perspectiva cíclica difícil para el espacio de activos digitales, lo que puede seguir justificando la precaución a muy corto plazo, quizás durante las próximas 4-6 semanas. Sin embargo, también creemos que los inversores deben adoptar un enfoque táctico hacia los mercados, porque esperamos que cuando el sentimiento finalmente se reajuste, es probable que suceda bastante rápido y seguimos siendo constructivos para la segunda mitad de 2025.
Mercados alcistas vs bajistas
Un umbral comúnmente citado para definir los mercados alcistas y bajistas en acciones es un movimiento del 20% o más desde un mínimo o máximo reciente del mercado, respectivamente. Esa cifra es algo arbitrarioy ciertamente es menos aplicable a los mercados de cripto, que rutinariamente experimentan fluctuaciones de precios del 20% en períodos cortos que no necesariamente señalan verdaderos cambios en el régimen del mercado. Es decir, los datos históricos muestran que las criptomonedas como bitcoin pueden caer un 20% en una semana pero seguir operando dentro de una tendencia alcista más amplia, o viceversa.
Además, las criptomonedas operan las 24 horas del día, los 7 días de la semana, lo que significa que a menudo actúan como un proxy para el sentimiento de riesgo más amplio durante esas horas en las que los mercados tradicionales están cerrados (por ejemplo, por las noches y los fines de semana). Esto puede amplificar las reacciones de los precios de las criptomonedas a eventos externos a nivel mundial. Por ejemplo, las acciones estadounidenses (representadas por el S&P 500) experimentaron una caída del 22% entre enero y noviembre de 2022 durante el ciclo de alzas de tasas de la Reserva Federal (bastante agresivo). En comparación, la caída en los precios del bitcoin, que comenzó presumiblemente antes (noviembre de 2021), culminó en una caída del 76% durante un período similar, una magnitud casi 3.5 veces mayor que la venta de acciones.
Verdad en contradicciones
Una de las primeras cosas a tener en cuenta sobre la métrica tradicional del 20% para los mercados alcistas y bajistas en acciones es que no hay una definición universalmente aceptada para lo que es (en el mejor de los casos) una regla empírica. Al igual que el juez de la Corte Suprema Potter Stewart's observación francaSobre la obscenidad ("Lo sé cuando lo veo"), identificar las tendencias del mercado a menudo se basa en la intuición y la experiencia en lugar de fórmulas rígidas.
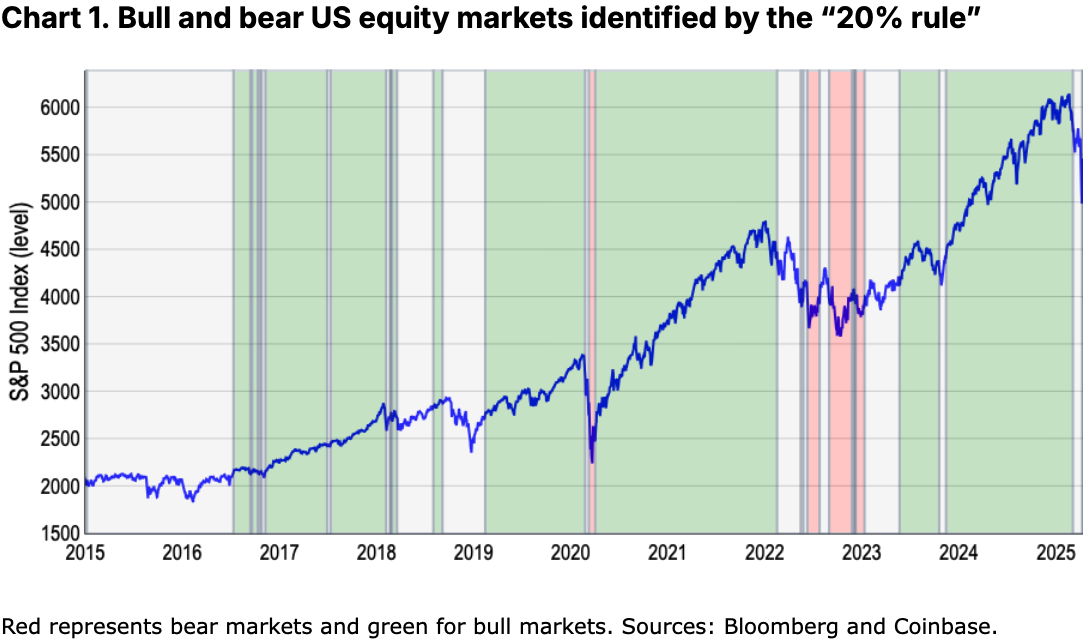
Aún así, en un esfuerzo por formalizar esta medida, analizamos los máximos y mínimos del mercado del S&P 500 dentro de una ventana de un año de precios de cierre para señalar las principales reversals. En los últimos diez años, esta métrica sugiere que ha habido alrededor de cuatro mercados alcistas y dos mercados bajistas en los valores estadounidenses, sin incluir la última venta a finales de marzo y principios de abril (donde nuestro modelo recientemente comenzó a mostrar una señal bajista). Ver Gráfico 1.
Sin embargo, este umbral pasa por alto al menos dos caídas significativas del 10-20% que impactaron drásticamente en el sentimiento del mercado en los últimos diez años, como los picos de volatilidad a finales de 2015 (turbulencia en el mercado de valores de China) y 2018 (preocupaciones comerciales globales, según la medida de la incertidumbre de la política comercial global de la Fed). Ver Gráfico 2.

En el pasado hemos visto que las caídas impulsadas por el sentimiento a menudo pueden desencadenar ajustes defensivos en la cartera, a pesar de no cumplir con el umbral arbitrario del 20%. En otras palabras, creemos que los mercados bajistas representan fundamentalmente cambios de régimen en la estructura del mercado, caracterizados por fundamentos deteriorados y liquidez reducida, en lugar de solo sus declives porcentuales. Además, la regla del "20%" corre el riesgo de generar complacencia al ignorar signos de advertencia temprana como la reducción de la profundidad del mercado y la rotación defensiva del sector, que históricamente preceden a las principales caídas.
Métricas alternativas
Por lo tanto, buscamos métricas alternativas que puedan capturar mejor la sutil interacción entre los movimientos de precios y la psicología de los inversores, tanto para acciones como para cripto. Los mercados bajistas se tratan tanto de sentimiento como de rendimiento real, porque eso tiende a determinar la sostenibilidad de las caídas de rendimiento que los inversores buscan evitar. Este puede ser un concepto complicado porque, si bien buscamos el cambio de tendencias a largo plazo, estos no necesariamente tienen que ser períodos prolongados de movimientos al alza o a la baja. La pandemia de COVID-19 es un buen ejemplo de un movimiento corto y brusco seguido de una reversión. Por supuesto, la naturaleza efímera de ese ciclo particular de mercado bajista se debió a la magnitud de las reacciones fiscales y monetarias posteriores tomadas por las autoridades a nivel mundial, rescatando a los inversores de lo que de otro modo podría haber sido una prolongada disminución.
En lugar de depender de una regla general, creemos que métricas como (1) rendimiento ajustado al riesgo (en términos de desviación estándar) y (2) el promedio móvil de 200 días (200d MA) pueden ofrecer pistas más sólidas sobre las tendencias generales del mercado para ambas clases de activos. Por ejemplo, vimos que bitcoin disminuyó 1.4 desviaciones estándar entre noviembre de 2021 y noviembre de 2022 en comparación con el rendimiento promedio del token en el período anterior de 365 días. Eso es comparable al movimiento de 1.3 desviaciones estándar en acciones en el mismo período de tiempo, lo que habla de la equivalencia de la caída del 76% de bitcoin y la caída del 22% del S&P 500, cuando se mide en términos ajustados al riesgo.

Debido a que esta métrica tiene en cuenta naturalmente la mayor volatilidad de las criptos, esto hace que los z-scores sean particularmente adecuados para los mercados de cripto, aunque no está exento de sus inconvenientes. No solo es algo más difícil de calcular, sino que esta métrica tiende a generar menos señales en mercados estables y puede no reaccionar tan rápidamente a los cambios en la tendencia general. Por ejemplo, nuestro modelo indica que el ciclo alcista más reciente terminó a finales de febrero. Sin embargo, desde entonces ha clasificado toda la actividad posterior como "neutral", destacando su posible retraso en las dinámicas de mercado que cambian rápidamente.

En comparación, creemos que el promedio móvil de 200 días (200DMA) ofrece un marco menos complejo y más robusto para identificar tendencias de mercado sostenidas. Al requerir al menos 200 días de datos para cálculos válidos, suaviza el ruido a corto plazo y se adapta a la acción reciente del precio, proporcionando una imagen más clara del impulso. Las 'reglas' son simples:
- un mercado alcista se caracteriza por el precio negociando consistentemente por encima de la 200DMA con impulso alcista, mientras
- un mercado bajista se caracteriza por un comercio persistente por debajo de este umbral de 200DMA acompañado de un impulso descendente.
En nuestra opinión, este enfoque no solo se alinea con las señales de tendencia más amplias en nuestra regla del "20%" y modelos de puntuación z, sino que también mejora la precisión necesaria para percepciones accionables en condiciones de mercado dinámicas. Por ejemplo, además de capturar las caídas observadas durante la pandemia (principios de 2020) y el ciclo de aumento de tasas de la Fed (2022-23), capturó el invierno cripto de 2018-19 y la caída a mediados de 2021 debido a la prohibición de la minería de criptomonedas en China. Además, encontramos que se ajusta mejor a los grandes aumentos y disminuciones en el sentimiento del inversor durante varios períodos. Vea los Gráficos 5 y 6.


¿Invierno de cripto?
Entonces, ¿estamos en un mercado bajista de cripto? Hasta ahora, nos hemos centrado principalmente en el análisis de bitcoin porque la comparación con los mercados tradicionales como las acciones estadounidenses requería un activo con suficiente historia. Sin embargo, aunque bitcoin se utiliza a menudo como un indicador del rendimiento general de las criptomonedas, utilizarlo como referencia para medir las tendencias del mercado cripto se está volviendo cada vez menos práctico a medida que la clase de activos se expande a nuevos sectores (por ejemplo, memecoins, DeFi, DePIN, agentes de IA, etc.).
Por ejemplo, el modelo de 200DMA en bitcoin sugiere que la reciente y pronunciada caída del token califica esto como un ciclo de mercado bajista que comienza a fines de marzo. Pero el mismo ejercicio realizado en el índice COIN50 (que incluye los 50 principales tokens por capitalización de mercado) muestra que la clase de activos en su conjunto ha estado negociando inequívocamente en territorio de mercado bajista desde finales de febrero. De hecho, esto es consistente con la capitalización de mercado total de cripto (ex-BTC) cayendo un 41% desde su máximo de diciembre de 2024 a $950 mil millones, en comparación con una caída (inferior al) 20% en bitcoin durante el mismo período. Esta disparidad subraya la mayor volatilidad y la prima de riesgo inherente a las altcoins más abajo en la curva de riesgo.

Conclusiones
A medida que el papel de bitcoin como un "depósito de valor" continúa creciendo, creemos que se necesitará una evaluación holística de la actividad del mercado cripto para definir mejor los mercados alcistas y bajistas para la clase de activos, especialmente dado que es probable que veamos un comportamiento cada vez más diverso en sus sectores en expansión. Sin embargo, tanto BTC como el índice COIN50 recientemente han roto por debajo de sus respectivas 200DMAs, lo que señala posibles tendencias bajistas a largo plazo en el mercado en general. Esto es coherente con la caída en la capitalización total del mercado cripto y el descenso enfinanciamiento de capital de riesgopara este espacio, las características de un posible invierno cripto en ascenso.
Por lo tanto, creemos que esto justifica adoptar una postura defensiva en cuanto al riesgo por el momento, aunque aún creemos que los precios de las criptomonedas pueden encontrar su punto de apoyo a mediados o finales del segundo trimestre de 2025, preparando un mejor tercer trimestre de 2025. Por ahora, los desafíos del entorno macroeconómico actual requieren una mayor precaución.
Descargo de responsabilidad:
Este artículo es reimpreso de [ Coinbase]. Forward the Original Title ‘Monthly Outlook: How Do You Define a Cripto Mercado bajista?’. All copyrights belong to the original author [David Duong, CFA - Jefe Global de Investigación]. Si hay objeciones a esta reimpresión, por favor contacte al Gate Learnequipo y lo resolverán rápidamente.
Responsabilidad de exención de responsabilidad: Las opiniones expresadas en este artículo son únicamente del autor y no constituyen ningún consejo de inversión.
Las traducciones del artículo a otros idiomas son realizadas por el equipo Gate Learn. A menos que se mencione, está prohibido copiar, distribuir o plagiar los artículos traducidos.
Artículos relacionados

¿Qué es Tronscan y cómo puedes usarlo en 2025?

¿Qué es SegWit?

¿Cómo apostar ETH?

Todo lo que necesitas saber sobre Blockchain

De la emisión de activos a la escalabilidad de BTC: evolución y desafíos
