1000億ドルのステーブルコイン急増背後の資本流入の包括的データ分析
2024年、ステーブルコインの時価総額は急増しましたが、オルトコインはそれに続きませんでした。Gate Research Instituteは、オンチェーンデータと資本流動分析を使用して、資金がDeFiプロトコル、支払い決済、機関取引に移行していることを明らかにし、暗号市場での「ステーブルコインの金融化」の新たな段階を示しています。オリジナルタイトル「1000億ドルのステーブルコイン急増背景の資本流入の包括的データ分析:オルトコインは上昇せず―お金はどこに行った?」を転送します
このPANewsの記事は、ステーブルコインの深いデータ解析を提供し、彼らの急成長によって提起された根本的な問題に答えることを目指しています: お金はどこに行ったのでしょうか?
2024年の初めから、グローバルなステーブルコイン市場は80.7%急上昇し、2350億ドルを超えました。USDT-USDCの二強は市場を引き続き支配し、その成長の86%を占めています。しかし、興味深いことに、イーサリアムとトロンに1,000億ドル以上が流入しても、これまでのサイクルとは異なり、オルトコイン市場に対応する急激な上昇は見られませんでした。データによると、今回は、ステーブルコイン供給の1ドル増加ごとに、オルトコイン市場の時価総額はわずか1.50ドル増加したということであり、前回のブルマーケットと比較して急激な82%の低下が見られました。
このPANewsの記事では、これらのステーブルコインの流入先が実際にどこに向かっているかを探っています。取引所の残高が急増している一方で、DeFiプロトコルのステーキング量も増加していますが、資本は伝統的な金融機関によるOTC取引や国境を越えた支払いのユースケース、新興市場における通貨代替にも静かに流れており、徐々に暗号世界の資本流動の景色を書き換えつつあります。
ステーブルコインはマーケットキャップに1000億ドルを追加 - イーサリアムとトロンが成長の80%を占める
DeFiLlamaのデータによると、ステーブルコインの総供給量は2024年の初めから2350億ドルから130億ドルに増加し、80.7%増加しました。この拡大の大部分は、まだ2つの主要なステーブルコインであるUSDTとUSDCによって推進されています。
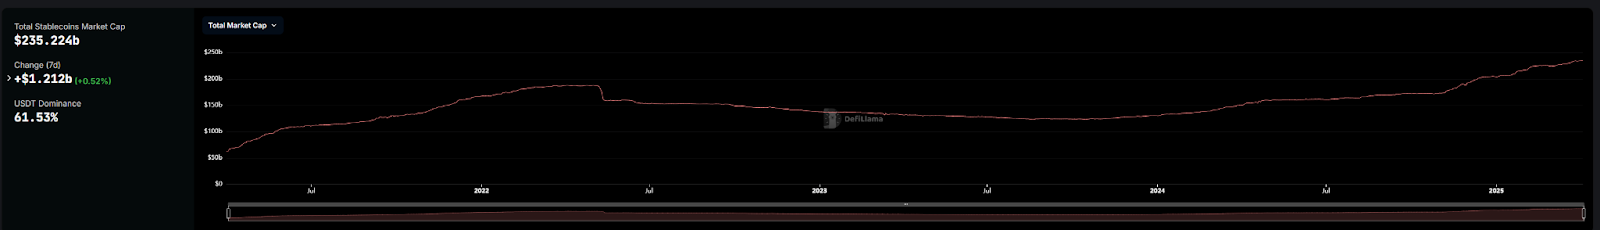
2024年1月1日、USDTの流通供給量は910億ドルでした。2025年3月31日には、1446億ドルに成長し、約536億ドル、総成長の51%増加しました。同じ期間に、USDCの供給量は238億ドルから606億ドルに増加し、成長の約35%を貢献しました。これら2つのステーブルコインは、市場シェアの87%を占めるだけでなく、この期間中の成長の86%を貢献しました。
ブロックチェーンで分解すると、イーサリアムとトロンはステーブルコインの発行において2つの主要なチェーンのままです。イーサリアムは総発行量の53.62%を占め、一方トロンは約28.37%を占め、合わせて81.99%のシェアを持っています。
2024年1月1日から2025年4月3日までの間、イーサリアムはステーブルコイン供給額が約580億ドル増加し、86%増加しました。米ドルテザー(USDT)およびUSDコイン(USDC)の成長率とほぼ同様の増加率となりました。一方、トロン(Tron)の成長率は約34%で、ステーブルコイン全体の拡大ペースには及びませんでした。

ステーブルコインの成長において三番目に大きなブロックチェーンは、同じ期間に供給が125億ドル増加したSolanaで、驚異的な584.34%の増加を記録しました。次に、新規発行額が40億ドルで成長率が2,316.46%のBaseが続きます。
トップ10のブロックチェーンの中で、Hyperliquid、TON、およびBerachainは、過去1年間に安定したコインを発行し始めたばかりです。これら3つのプラットフォームは、新しい安定したコイン供給で約38億ドルを貢献し、全体の成長の3.6%を占めています。要約すると、イーサリアムとトロンは、安定したコインの活動において依然として主要なプラットフォームとなっています。
新しい1ドルは、オルトコインの時価総額を1.50ドルしか増やさない-劇的な減少
ステーブルコインのオンチェーン拡張が急速に進んでいるにもかかわらず、同じ期間にオルトコイン市場の成長は物足りないものでした。
比較のために:2020年3月、BTCとETHを除く総altcoinの時価総額は約398億ドルでした。しかし2021年5月には8135億ドルに急増し、19.43倍になりました。同じ期間に、stablecoin市場は61.4億ドルから992億ドルに急成長し、ほぼ15倍になり、比較的同期した成長パターンを示しています。
現在のブルマーケットでは、ステーブルコインの時価総額は80%増加していますが、オルトコインの総時価総額はわずか38.3%増加しており、約1599億ドルです。

過去を振り返ると、2020年から2021年のサイクルでは、ステーブルコイン1ドルの追加ごとにオルトコイン市場キャップが8.30ドル増加しました。しかし、2024年から2025年のサイクルでは、その比率がわずか1.50ドルにまで急落しました。この劇的な低下は、新しく発行されたステーブルコインがもはや主にオルトコインを購入するために使用されていないことを示唆しています。
お金はどこに行ったのですか? それが鍵となる質問です。
パブリックチェーンの景観が変化しています:イーサリアムとトロンはしっかりしていますが、ソラナとベースは突破しています
一見すると、Solana上のMEMEコインの熱狂は、このブルランの特徴となっているようです。しかし、ほとんどのMEME取引活動はSOLペアに対して行われ、ステーブルコインの関与は限られています。以前にも述べたように、ステーブルコインの大部分の成長はまだEthereum上で起こっています。
ステーブルコインが実際にどこに流れているかを明らかにするには、イーサリアムやUSDT、USDCなどの主要なステーブルコインに注意を払い続ける必要があります。
分析に入る前に、安定コイン利用に関する一部の主流理論を概説しましょう。市場の憶測では、それらは支払シナリオ、ステーキング収益、価値の保存としてますます利用されているとされています。
イーサリアム上のステーブルコイン取引活動を調査してみましょう。次のチャートは、取引量の変動に規則的な鼓動のようなパターンがあり、ステーブルコインの使用に潜在的なパターンを示している可能性があります。

短い時間枠でズームインすると、明確な取引リズムが現れます。これは「5+2」パターンと呼ばれ、活発な5日間の後に低い活動が2日間続きます。特筆すべきは、低いポイントが一貫して週末にあることで、取引量は一般的に月曜日から水曜日にかけて増加し、その後木曜日と金曜日に減少していきます。
この一貫した変動は、安定通貨取引の相当部分が機関や企業によって推進されている可能性を示唆しています。もし安定通貨が主に消費者レベルの支払いに使用されているとすれば、週初め/週末の変動がそれほど顕著であることは期待されません。

さらに、1日の取引頻度を見ると、イーサリアム上のUSDTの送金はほとんど1日に30万を超えることはめったにありません。週末には、送金件数と平均送金額の両方が目立って減少する傾向があり、制度活動の仮説をさらに支持しています。
USDTが取引所に流入し、USDCがDeFiに沈む
ウォレットの分布を見ると、過去1年間で中央集権取引所におけるUSDT残高が大幅に増加しています。2024年1月1日、取引所保有残高は15.2十億USDTでした。2025年4月2日には、この数字が40.9十億USDTに上昇しました。つまり、250億ドル、または169%増加しました。
この成長率は、安定したコイン供給全体の80.7%増加をはるかに上回っており、同じ期間に発行されたUSDTの48%を占めています。

言い換えれば、過去1年間の新しいUSDT供給のおおよそ半分が直接取引所に流入してきたということです。

しかし、USDCはまったく異なるストーリーを伝えています。2024年1月1日時点で、取引所は約206億USDCを保有していました。2025年4月2日時点では、これがたったの498億USDCに増加していました。同じ期間に、総USDC供給量は368億USDC増加しました。つまり、新しいUSDCの約7.9%しか取引所に流通していないということです。
合計して、取引所が保有するUSDCは、流通供給量のわずか8.5%に過ぎない—USDTの28.4%よりもはるかに少ないです。
これは使用上の重大な乖離を示しています:ほとんどの新しいUSDTは中央集権的な取引プラットフォームに流入していますが、新しく発行されたUSDCはほとんど取引所を避けています。

USDCの新しい流入先を理解するためには、最大の保有物がどこにあるかを調査する必要があります。これによって、より広範な市場資本の流れが明らかになります。
アドレスの配布の観点から見ると、イーサリアム上のトップUSDC保有アドレスの多くはDeFiプロトコルに属しています。たとえば、USDCの最大保有者は、MakerDAOに関連するウォレットであるSkyで、合計USDC供給量の約11.9%にあたる48億USDCを保有しています。2024年7月にはこのアドレスはわずか2,000万USDCしか保有していませんでした。それは驚異的な数値であり、わずか1年未満で229倍に増加しました。
Skyは主にUSDCを担保として使用して、独自のステーブルコインであるDAIとUSDSを発行しています。このアドレスが保有するUSDCの増加は、DeFiの総ロックアップ価値(TVL)の成長によって駆動されるステーブルコインへの需要の増加を反映しています。
Aaveは、イーサリアム上のUSDCの第4位の保有者としてランク付けされているもう1つの主要なDeFiプロトコルです。2024年1月1日、Aaveは約4500万USDCを保有していました。2025年3月12日までに、これは132億USDCに急増しました。この金額だけでも、イーサリアム上で新たに発行されたUSDCの7.5%を占めています。

これにより、イーサリアム上のUSDCの増加は主にステーキングや貸出商品の増加によるものであることが明らかとなります。2024年初めには、イーサリアムの総ロックアップ価値(TVL)は約297億ドルでした。最近の下落にもかかわらず、TVLは依然として約490億ドル(最高760億ドル)の水準を維持しています。490億ドルの数字に基づくと、イーサリアムのTVLはおよそ64.9%増加しており、昨年のオルトコイン市場の成長を上回り、全体的なステーブルコインの成長率に密接に沿っています。
ただし、絶対的な価値では、EthereumのTVLは約193億ドル増加していますが、同時期にEthereum上の総ステーブルコイン供給は580億ドル増加しています。これは、取引所への流入を考慮しても、ステーキングプロトコルが新しいステーブルコイン供給のすべてを吸収していないことを示しています。
新たなユースケースの台頭: クロスボーダー決済から機関取引へ
DeFiを超えて、安定したコインへの需要が増加しており、小売支払い、国境を越えた送金、機関投資家向けのOTC取引など新興の用途によってますます推進されています。
Circleのさまざまな公式ソースによると、ステーブルコインは支払いや送金アプリケーションで実際の有用性を示し始めています。Riseの報告によると、世界の送金の約30%が今やステーブルコインを使用して行われているとされています。この傾向は特にラテンアメリカとサハラ以南のアフリカで顕著であり、小売業とプロフェッショナル向けのステーブルコイン送金は2023年7月から2024年6月までの間に年間40%以上成長しました。
Circleはまた、2024年に、スタンダードチャータード銀行のデジタル資産ブローカレージであるZodia Marketsが、合計で40億ドル相当のUSDCを発行したことも明らかにした。Zodia Marketsは、OTC取引やオンチェーン外国為替(FX)などのサービスを提供している機関投資家向けのサービスを提供しています。

成長する実世界ステーブルコインの使用例として、ラテンアメリカの小売支払い会社であるLemonが挙げられます。同社のユーザーは現在、主に日常の支払いにステーブルコインを使用しており、約137百万ドル以上のUSDCを保有しています。
使用シナリオの違いを超えて、各ブロックチェーンエコシステムのユニークな構造は、ステーブルコインに対する需要のレベルをもさまざまに生み出します。たとえば、Solana上のMEMEコインブームはDEX(分散型取引所)の取引の需要を刺激しました。
PANewsの不完全な統計によると、Solana上のトップ100のUSDC取引ペアは、約22億ドルのTVLを保有しています。USDCがこの流動性の約半分を占めると仮定すると、Solana上で発行されたUSDCの約11億ドル、またはUSDC総量の約8.8%に相当します。
「投機的バブル」から「次世代金融商品」へ
ステーブルコインのトレンドを分析した後、PANewsは、ステーブルコイン供給の増加の背後にある単一の要因を特定することが難しいと結論付けています。その結果、中心となる問い「お金はどこに行ったのか?」には明確な答えがありません。
しかし、分析は多面的な現実を明らかにしています。
- ステーブルコインの時価総額は引き続き成長していますが、明らかにこれらの資金はアルトコインにはほとんど流れていないようです。この成長は過去のサイクルで見られたようなアルトコインシーズンを推進していません。
- イーサリアムでは、USDTの成長の約半分が取引所に流れています。ただし、ETHやオルトコインの価格変動がないことを考えると、この資本の大部分はBTCを購入したり、取引所ベースの利回り商品に保管されている可能性が高いです。残りの部分はおそらくDeFiプロトコルに吸収されています。全体として、イーサリアムに流入する資本は、貸出やステーキングプロトコルにおける安定した利回り商品により焦点を当てているようです。伝統的な資本にとっての暗号通貨の魅力は、投機的な利益から構造化された金融商品への移行しているようです。
- 機関の関与(例:スタンダードチャータード)や未開発地域での採用など、新たな需要源としてのステーブルコインの台頭など、新興のユースケースが出現しています。これらの地域は、しばしばインフラの制約や不安定な地元通貨に直面しており、ステーブルコインは魅力的な選択肢となっています。ただし、このセグメントはまだ十分に文書化されておらず、その全体像は未知のままです。
- 各ブロックチェーンは、ステーブルコインに対する独自の物語と使用事例を示しています。 Solanaでは、MEMEコインブームを中心にDEX取引が成長を牽引しています。Hyperliquid、Berachain、TONなどの新しいチェーンでは、エコシステム開発に対する興奮が資本の増加需要を生み出しています。
この資本移動の暗流を総合的に捉えると、暗号市場でのパラダイムシフトが指摘されています。ステーブルコインは、取引媒体としての役割を超えて進化し、伝統的金融と分散型エコシステムを結ぶ価値パイプラインとなっています。一方で、ステーブルコインの流入から従来享受していたアルトコインへの流動性の後押しは得られていません。一方で、収益の機関需要、未開発市場における支払いユースケース、オンチェーン金融インフラの成熟により、ステーブルコインはより広範囲な価値を担う役割に推進されています。これは暗号通貨における歴史的な転換点を示すかもしれません:投機主導のダイナミクスから価値の定着と実世界での有用性への静かな移行。
免責事項:
この記事は[からの翻訳転載ですPANews原題『1000億ドルのステーブルコイン急増背後の資本流動の包括的データ分析:オルトコインは上昇せず──資金はどこへ行ったのか?』を転載します。すべての著作権は元の著者に帰属します[フランク]. この翻訳に関するご質問がある場合は、ご連絡ください。Gate Learnチーム。
免責事項:この記事で表現されている意見は、著者個人のものであり、投資アドバイスを構成するものではありません。
他の言語への翻訳はGate Learnチームによって提供されています。これらの翻訳を無断でコピー、配布、あるいは盗用しないでくださいGate.io.
関連記事

ETHを賭ける方法は?


ソラナとは何ですか?

ゲートトークン(GT)とは何ですか?

アルトコインとは?
