🎉 Gate.io Growth Points Lucky Draw Round 🔟 is Officially Live!
Draw Now 👉 https://www.gate.io/activities/creditprize?now_period=10
🌟 How to Earn Growth Points for the Draw?
1️⃣ Enter 'Post', and tap the points icon next to your avatar to enter 'Community Center'.
2️⃣ Complete tasks like post, comment, and like to earn Growth Points.
🎁 Every 300 Growth Points to draw 1 chance, win MacBook Air, Gate x Inter Milan Football, Futures Voucher, Points, and more amazing prizes!
⏰ Ends on May 4, 16:00 PM (UTC)
Details: https://www.gate.io/announcements/article/44619
#GrowthPoints#

Solana Price at Critical Levels: What Should Investors Do?
Solana (SOL), which has shown an increase of nearly 20% in the last week, has attracted the attention of investors. However, caution is needed about the continuity of this rise. Although technical indicators present a positive picture, the sustainability of this trend appears to be dependent on general market movements. In other words, this situation carries both opportunities and risks for investors.
BBTrend: The Rise Isn't Strong Enough Yet
First of all, the BBTrend indicator of Solana (SOL) is currently at 2.53. This value had indicated an oversold pressure by dropping to -10 a few days ago. However, we see a slight recovery and a renewed buyer interest. This situation indicates that the market's confidence in Solana is increasing again.
BBTrend is a momentum measurement based on Bollinger Bands. Therefore, positive values indicate strength, while negative values indicate weakness. Solana's BBTrend value does not yet indicate a high momentum compared to the overall market. However, this situation suggests that the rise could largely be due to new highs in Bitcoin. Therefore, investors need to carefully monitor whether this rise will continue.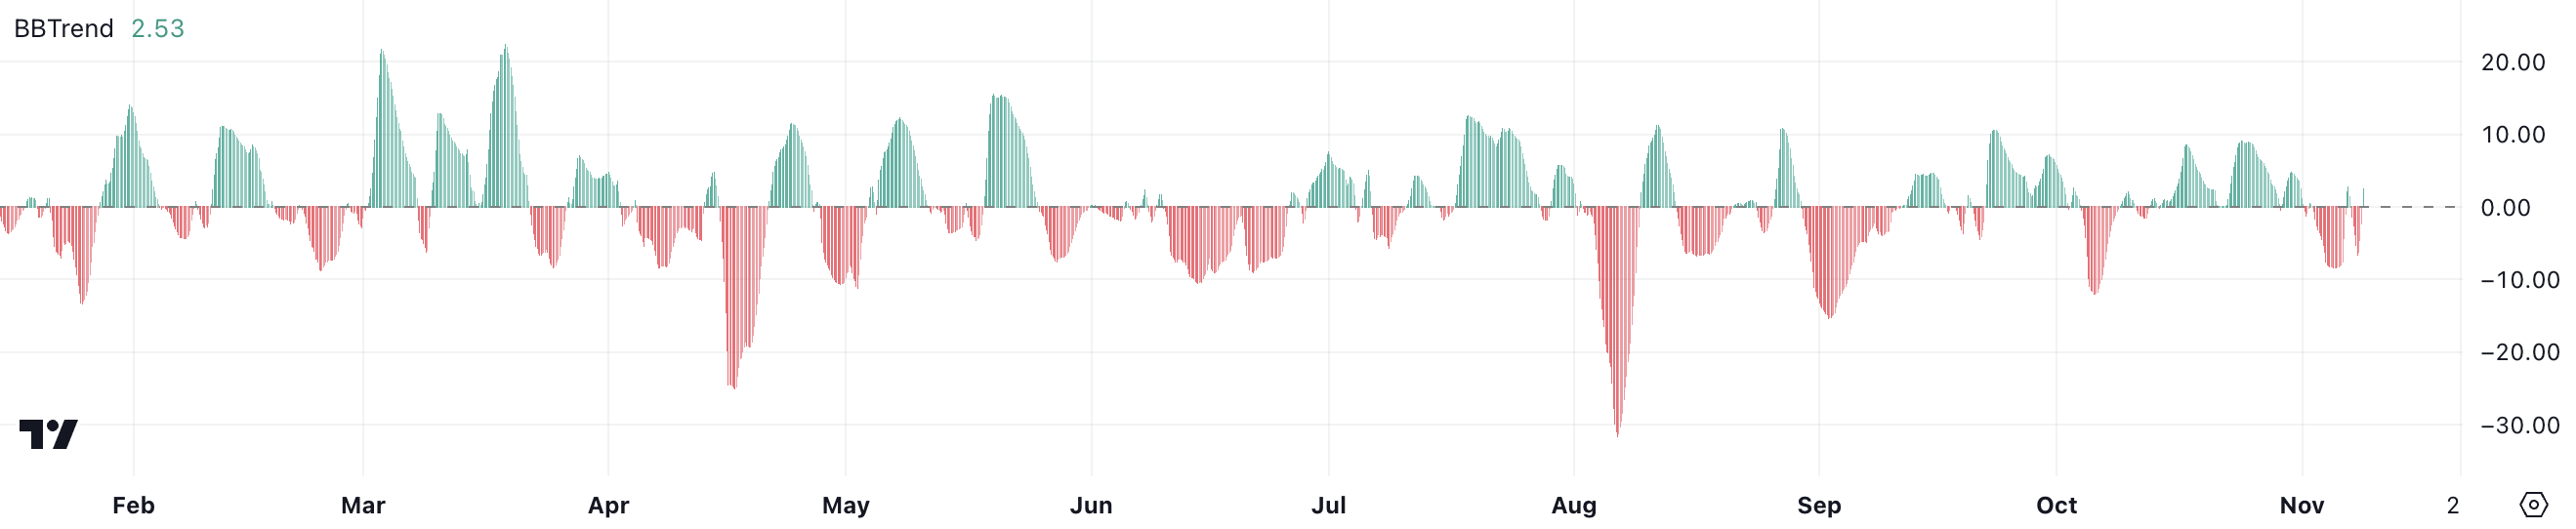
DMI Indicator: Solana in a Strong Uptrend
In addition, the Directional Movement Index (DMI) chart shows Solana's ADX value as 47.3. This value, which was only around 10 last week, indicates a significant increase in trend strength. More importantly, the fact that this rise has occurred in a very short period of time is remarkable.
Will Solana reach $210?
In addition to all this, Solana's EMA lines also present a very positive picture. Currently, the price is trading above all EMA lines, and short-term EMAs are positioned above long-term EMAs. This indicates a clear uptrend. Also, the widened distance between the EMAs indicates a strong upward momentum.
If this strong momentum continues, it seems quite likely that Solana will test the $210 resistance. This level will be the highest price point since March. However, it should be remembered that if there is a weakness in the overall market sentiment, Solana could pull back to the $179 or $165 support levels. At this point, the sustainability of the trend will largely depend on Bitcoin's performance and the overall market sentiment. As reported by Kriptokoin.com, it is important for investors to be cautious and closely monitor market developments.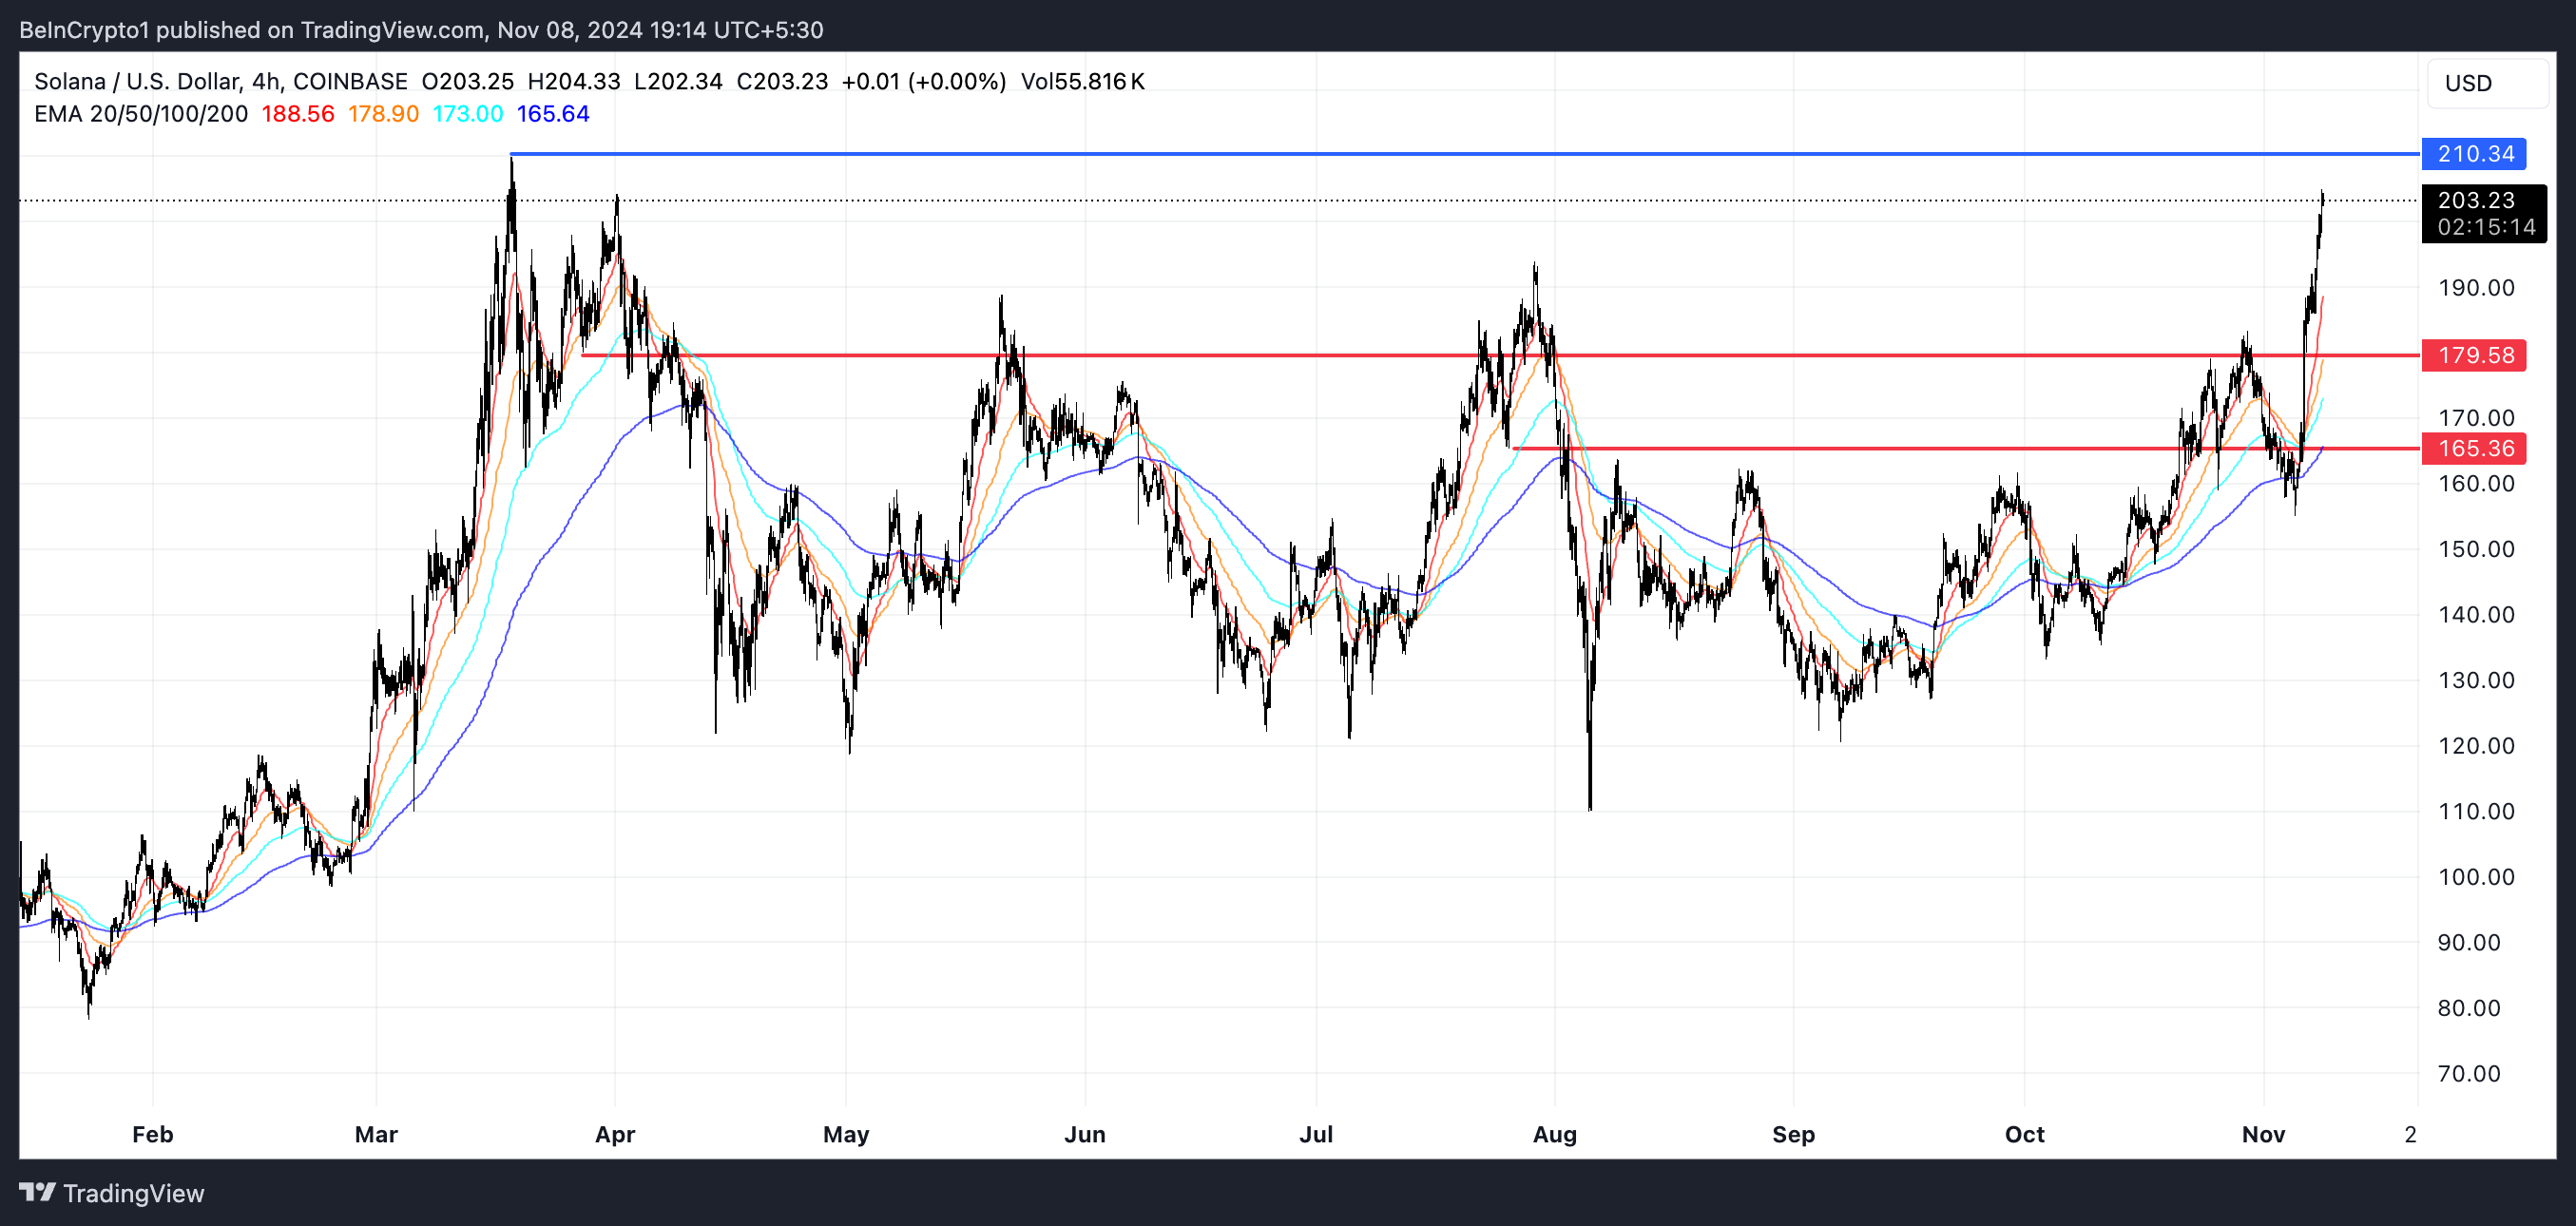
To be instantly informed of the latest developments, follow us on Twitter**, Facebook, and Instagram and join our Telegram and YouTube channels!